Farasis S35(B)
Get everything you need for the sodium-ion battery cell Farasis S35(B): Extensive measurement data in the total operation regime, and a high-precision, physical battery model with global validity.
| Cell Origin | purchased on free market |
| Cell Format | pouch |
| Dimensions | 226 x 159 x 10.8 mm |
| Weight | 734.4 g |
| Capacity definitionclose
The nominal capacity originates from the manufacturer’s data sheet, if available. When the data sheet is unavailable, the nominal capacity is estimated. Batemo measured the C/10 capacity by discharging the cell at an ambient temperature of 25°C from 100% with a constant current of 3.43A (0.1C) until reaching the voltage of 1.5V. The thermal boundary condition is free convection. |
nominal 34.3 Ah C/10 36 Ah |
| Current definitionclose
All quantities are measurement results from the Batemo battery laboratory. The continuous current is the highest current that completely discharges the cell without overheating it. Therefore, the cell is discharged from 100% state of charge (SOC) at an ambient temperature of 25°C with a constant current until a residual state of charge of 10% and either the lower voltage limit of 1.5V or 90% of the maximum surface temperature (50°C) is reached. The peak current is the current that the cell can supply for 5 minutes. The cell is therefore discharged from 100% SOC at an ambient temperature of 25°C with a constant current until it reaches either the lower voltage limit of 1.5V or the maximum surface temperature of 55°C after 5 minutes. For cells that reach the maximum surface temperature, the measured current is taken directly as the peak current. For cells that do not reach the maximum surface temperature after 5 minutes because they reach the lower voltage limit first, the measured current is multiplied by a correction factor that estimates the current that would have heated the cell to the maximum surface temperature within 5 minutes. The thermal boundary condition is free convection. These operating conditions may be outside the cell manufacturer’s specification. |
continuous 89.8 A peak 192 A |
| Energy definitionclose
Batemo measured the C/10 energy by discharging the cell at an ambient temperature of 25°C from 100% with a constant current of 3.43A (0.1C) until reaching the voltage of 1.5V. The thermal boundary condition is free convection. |
C/10 110.2 Wh |
| Power definitionclose
All quantities are measurement results from the Batemo battery laboratory. The continuous power is the highest power that completely discharges the cell without overheating it. Therefore, the cell is discharged from 100% state of charge (SOC) at an ambient temperature of 25°C with a constant current until a residual state of charge of 10% and either the lower voltage limit of 1.5V or 90% of the maximum surface temperature ( 50°C) is reached. The peak power is the power the cell can supply for 5 minutes. The cell is therefore discharged from 100% SOC at an ambient temperature of 25°C with a constant current until it reaches either the lower voltage limit of 1.5V or the maximum surface temperature of 55°C after 5 minutes. For cells that reach the maximum temperature limit, the measured power is directly taken as peak power. For cells that do not reach the maximum surface temperature after 5 minutes because they reach the lower voltage limit first, the measured power is multiplied by a correction factor that estimates the power that would have heated the cell to the maximum surface temperature within 5 minutes. The thermal boundary condition is free convection. These operating conditions may be outside the cell manufacturer’s specification. |
continuous 258 W peak 593 W |
| Energy Density definitionclose
The energy densities result from the C/10 energy, the cell weight and the cell volume. |
gravimetric 150 Wh/kg volumetric 309 Wh/l |
| Power Density definitionclose
The power densities result from the peak power, the cell weight and the cell volume. |
gravimetric 807 W/kg volumetric 1.66 kW/l |
Farasis S35(B) Model
The Batemo Cell Model of the sodium-ion battery cell Farasis S35(B) is a high-precision, physical cell model with global validity. As a digital twin it seamlessly integrates into your research, development and battery analytics by basing your decisions on simulations. See the details to learn more about the features and capabilities of the Batemo Cell Model.
| Batemo Cell Model Version | 1.313 |
| Release Date | March 31, 2025 |
Batemo demonstrates the accuracy and validity of the Batemo Cell Model by comparing battery simulation and measurement data in the range given below. Validation is extensive, experimental characterization covers the total operational area of the cell: At low and high temperatures, up to the maximal current and in the whole state of charge range.
| State of Charge Range | 0 … 100% |
| Current Range definitionclose The current range are the electrical current limits as used in the Batemo battery laboratory. Please see the Farasis S35(B) data sheet for the precise definition of the current safe area of operation of the cell. |
-206 A discharge … 51 A charge (-6C … 1.5C) |
| Voltage Range definitionclose The voltage range are the electrical voltage limits as used in the Batemo battery laboratory. Please see the Farasis S35(B) data sheet for the precise definition of the voltage safe area of operation of the cell. |
1.5 … 3.9 V |
| Temperature Range definitionclose The temperature range are the thermal limits as used in the Batemo battery laboratory. Please see the Farasis S35(B) data sheet for the precise definition of the temperature safe area of operation of the cell. |
-20 … 55 °C |
Moreover, the validation of the Batemo Cell Model is fully transparent. The Batemo Cell Data contains the raw measurement and simulation data. For all experiments the voltage, temperature, power and energy accuracies are calculated. This allows straight-forward evaluation and analysis of the Batemo Cell Model validity. The graphs show a selection of characteristic data of the cell Farasis S35(B) to evaluate the cell performance.
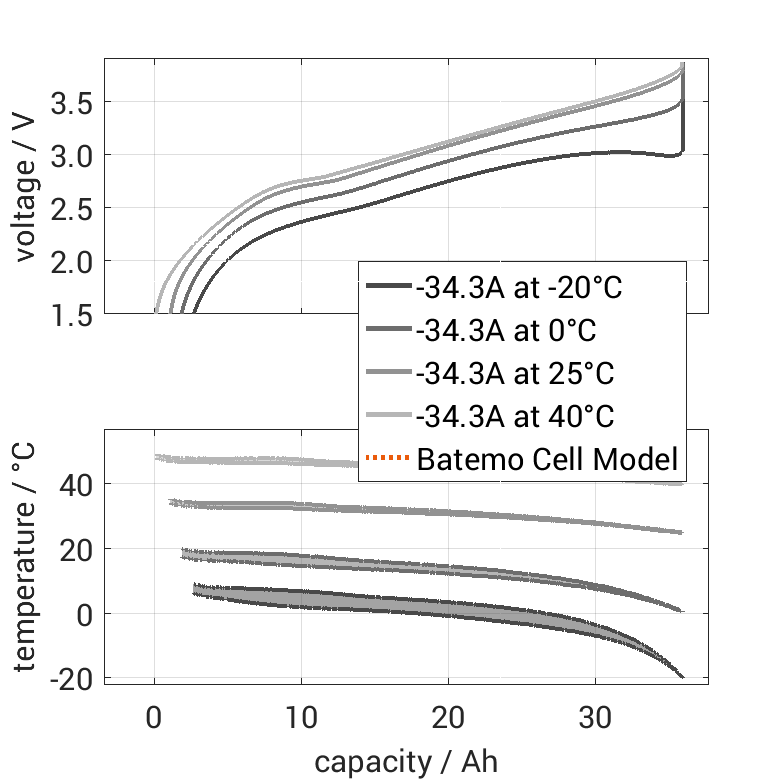
- Discharge Characteristics: The electrical and thermal discharge behavior is strongly nonlinear.
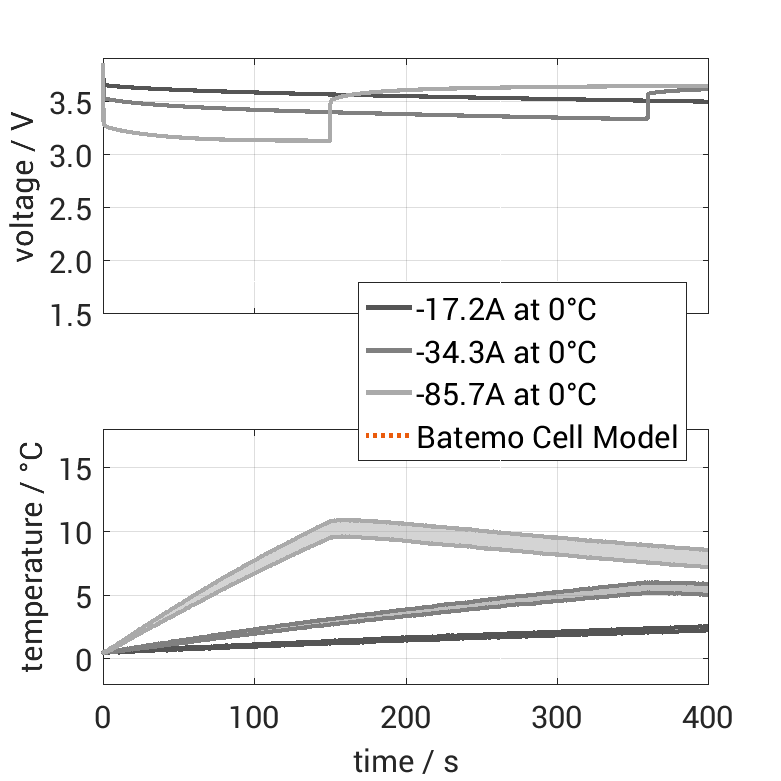
- Pulse Characteristics: The shape of different current pulses changes strongly.
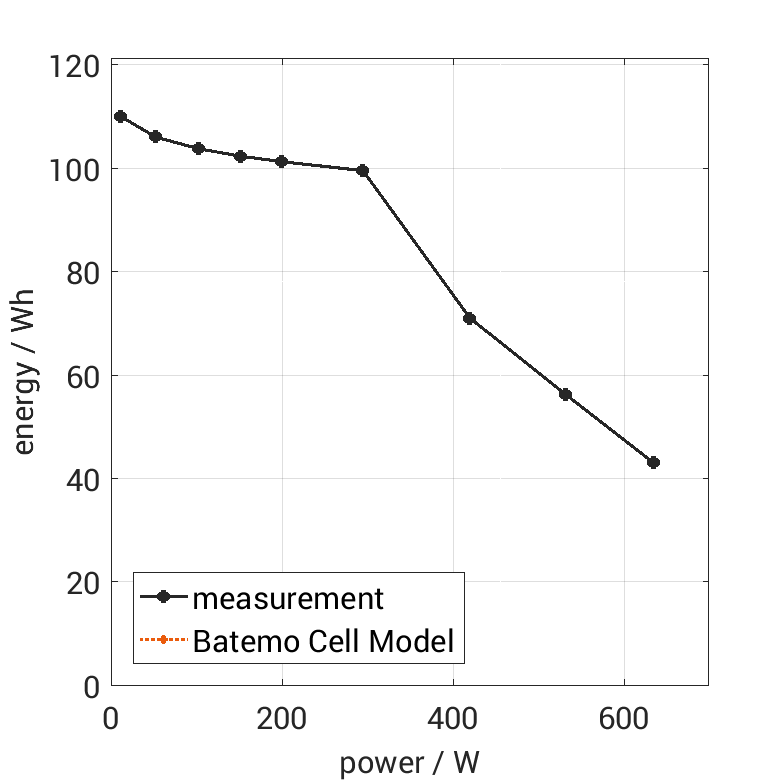
- Energy Characteristics: The graph visualizes how much energy the cell can deliver when operated at different powers.
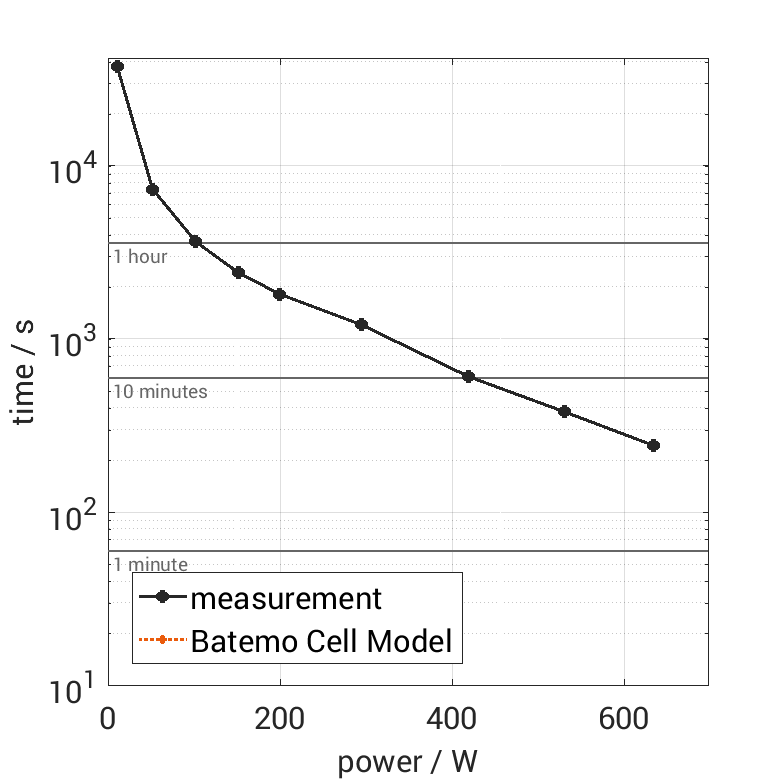
- Power Characteristics: The more power the cell supplies, the shorter it can deliver the power.
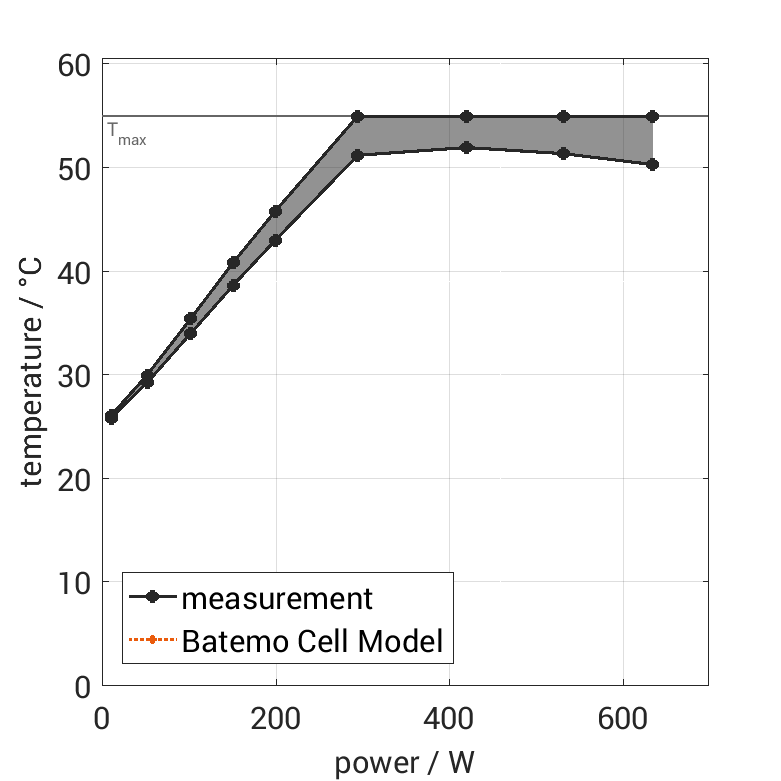
- Thermal Characteristics: The greater the thermal losses, the more the cell heats up, resulting in higher depleted power.
show experiment definitionsclose
The cell is discharged from 100% SOC with different constant currents at different ambient temperatures. The thermal boundary condition is free convection. The measurement stops when reaching either the voltage of 1.5V or the surface temperature of 55°C.
The cell is discharged from 100% SOC with current pulses followed by no-load phases at different ambient temperatures. The thermal boundary condition is free convection. The measurement stops when reaching either the voltage of 1.5V or the surface temperature of 55°C. The graph shows a zoomed view of the measurement to visualize one of the pulses.
The cell is discharged from 100% SOC with different constant currents at 25°C. The thermal boundary condition is free convection. The measurement stops when reaching either the voltage of 1.5V or the surface temperature of 55°C. The graph shows the derived exchanged energy and average power of the experiment.
The cell is discharged from 100% SOC with different constant currents at 25°C. The thermal boundary condition is free convection. The measurement stops when reaching either the voltage of 1.5V or the surface temperature of 55°C. The graph shows the derived experiment duration and average power of the experiment.
The cell is discharged from 100% SOC with different constant currents at 25°C. The thermal boundary condition is free convection. The measurement stops when reaching either the voltage of 1.5V or the surface temperature of 55°C. The graph shows the cell surface temperature at the end and the derived average power of the experiment.
The mean accuracies give an overview of the Batemo Cell Model accuracy. Therefore, the root mean square of the difference between the measurement and simulation result is derived for the voltage, the temperature, the energy and the power. Relative numbers relate the accuracy to the respective absolute value.
| Mean Voltage Accuracy | 0.027 V | 1.3 % |
| Mean Temperature Accuracy | 0.5 K | 0.6 % |
| Mean Power Accuracy | 1.06 W | 0.9 % |
| Mean Energy Accuracy | 0.93 Wh | 1.7 % |
The Batemo Cell Model precisely describes all aspects of the cell. It is the perfect tool for battery system development.
Farasis S35(B) Data
Batemo offers an extensive, experimental characterization of the sodium-ion battery cell Farasis S35(B). The data contains measurement results in the total operational area of the cell. The descriptions and graphs below explain and show the available measurements. The Batemo Cell Viewer allows easy and fast analysis, evaluation and comparison of the data. See the details to learn more.
Constant Currents
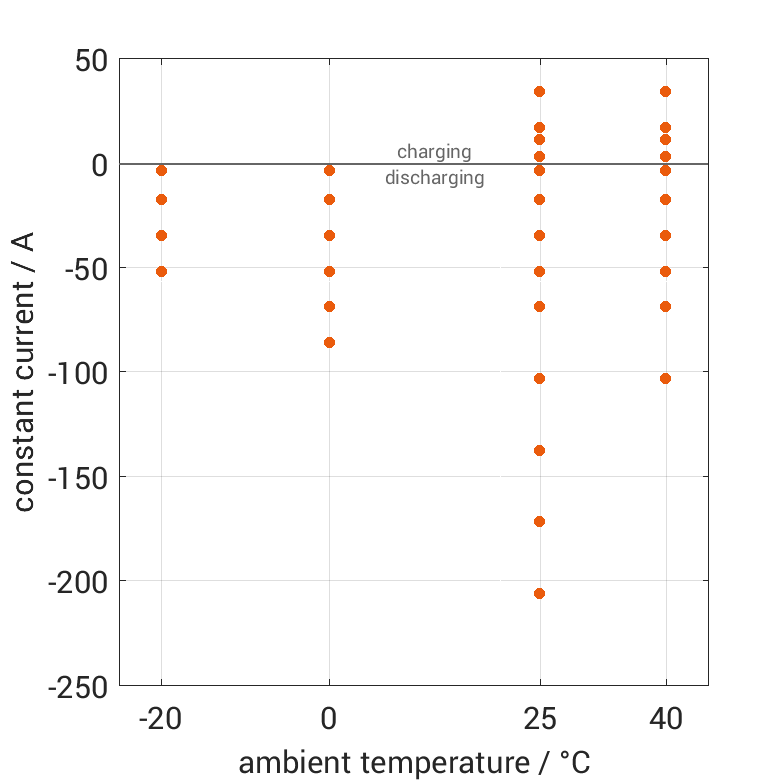
The cell is discharged from 100% SOC or charged from 0% SOC with different constant currents at different ambient temperatures. The thermal boundary condition is free convection. The measurement stops when reaching either the voltage of 1.5V or 3.9V or the surface temperature of 55°C. The graph shows for which ambient temperatures and charging and discharging constant currents measurements are available.
Pulse Currents
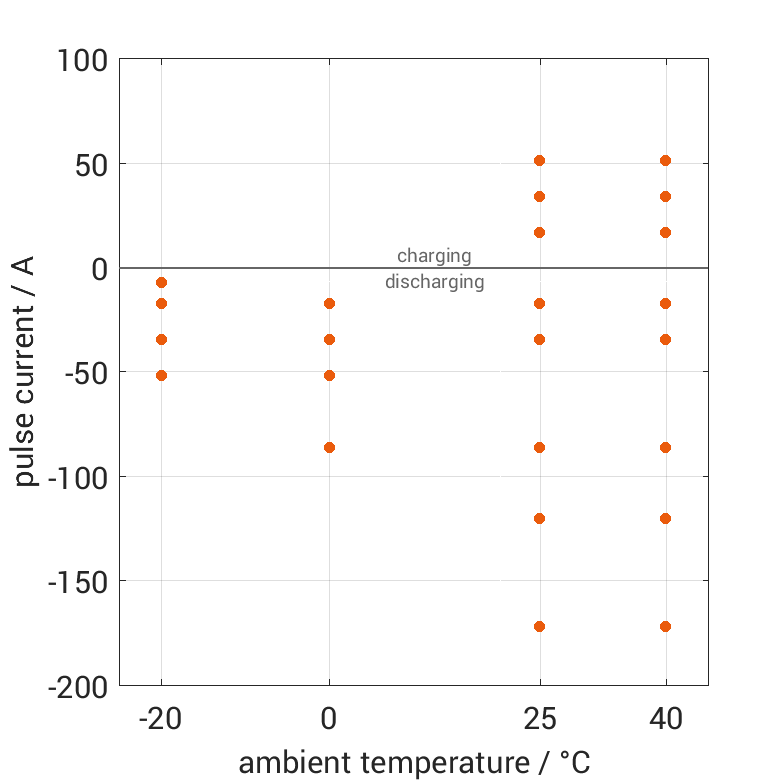
The cell is discharged from 100% SOC or charged from 0% SOC with current pulses followed by no-load phases at different ambient temperatures. The thermal boundary condition is free convection. The measurement stops when reaching either the voltage of 1.5V or 3.9V or the surface temperature of 55°C. The graph shows for which ambient temperatures and pulse currents measurements are available.
Power Profiles
| Ambient Temperature |
Available Profiles |
|---|---|
| -20 °C |  |
| 0 °C |  |
| 25 °C |  |
| 40 °C |  |
The cell delivers a typical power profile from 100% SOC at different ambient temperatures. The thermal boundary condition is free convection. The measurement stops when reaching either the voltage of 1.5V or the surface temperature of 55°C. The table summarizes for which ambient temperatures the profile is available.
Farasis S35(B) Report
Batemo offers a detailed report of the sodium-ion battery cell Farasis S35(B). The report covers all important aspects about the cell. This information greatly helps you to further evaluate and compare the cell. It is a profound basis for your decisions concerning your battery system design. See the details to learn more.
| Performance Overview |  |
| Cell Exterior |  |
| Cell Interior |  |
| Safety Features |  |
| Electrode Microstructure and Material |  |


